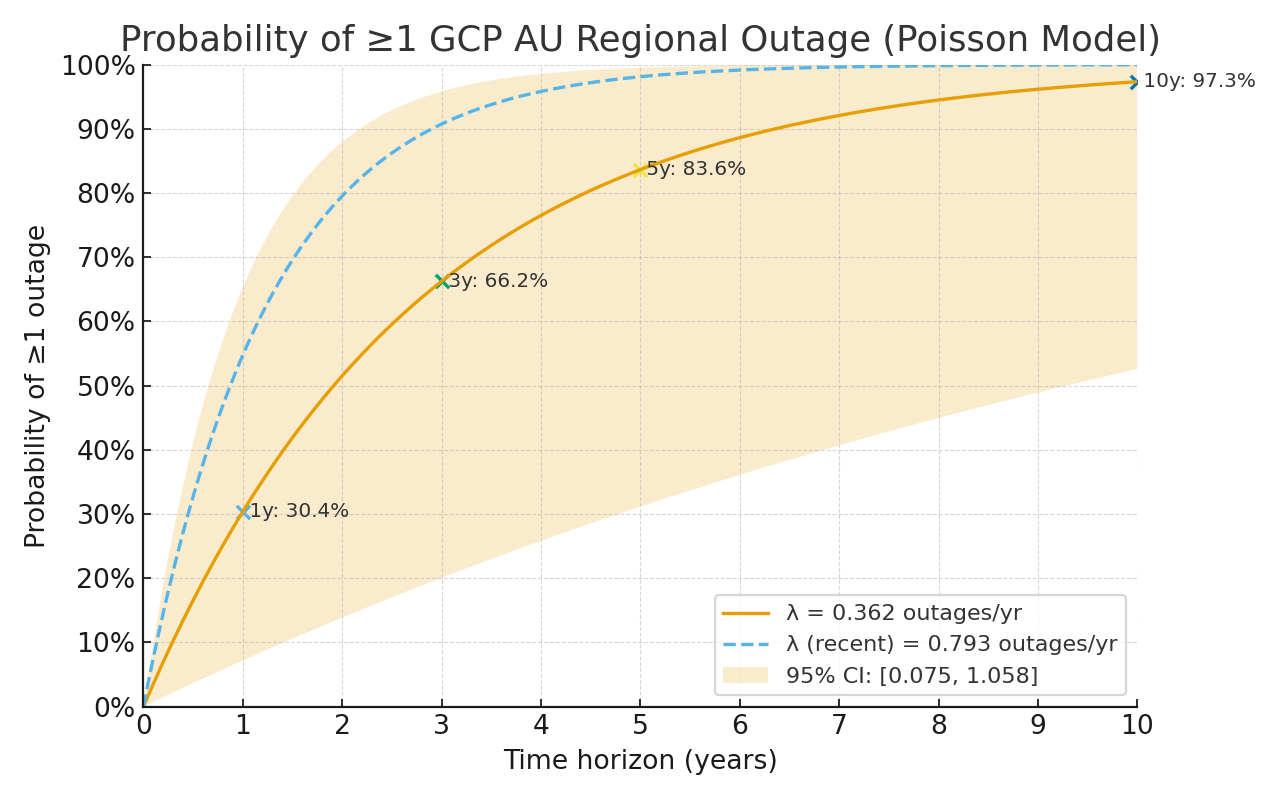
Estimating the Probability of a GCP Regional Outage Using Poisson Models
Cloud outages are inevitable, but quantifying their likelihood is often hand-waved away as “rare.”
Let’s take a more data-driven approach and actually compute the probability of a regional outage — specifically for Google Cloud Platform’s Australian regions (Sydney and Melbourne) — using a simple Poisson distribution model.
1. Why Poisson?
The Poisson distribution is ideal for modeling rare, discrete events that occur independently over time — like earthquakes, hard-drive failures, or, in this case, cloud regional outages.
If we can estimate the average rate (λ) of such events per year, the Poisson formula gives us the probability of seeing zero, one, or multiple outages in any time window:
1P(N = k) = ((λT)^k * e^(-λT)) / k!
and the probability of at least one outage is:
1P(N ≥ 1) = 1 - e^(-λT)
Where:
- λ = average outages per year
- T = number of years into the future we’re projecting
2. Data: GCP Outages in Australia
We gathered all published, region-wide or multi-service incidents for Google Cloud’s Australia Southeast regions from the official Google Cloud Status Dashboard.
For clarity, we excluded single-product or global issues that merely listed Australia among many affected locations.
| Date | Region | Duration | Scope / Root Cause |
|---|---|---|---|
| 2022-12-09 | Sydney + Melbourne | ~3 h | IAM service failure across Asia/Australia, cascading into multiple services |
| 2024-05-08 | Sydney | ~3 h | Broad multi-service disruption (Compute, Storage, SQL, BigQuery, etc.) |
| 2024-10-29 | Melbourne | ~22 min | Power voltage swell at data-center campus causing multi-product impact |
Count: 3 major regional or multi-service outages since 2017.
Observation window: ~8.29 years (Sydney launched mid-2017, Melbourne in 2021).
3. Estimating the Outage Rate
1λ = (3 outages) / (8.29 years) = 0.362 outages/year
So, on average, one major regional outage every 2.76 years.
To account for statistical uncertainty in such a small sample, we use a 95 % confidence interval for the true rate:
1λ ∈ [0.0746, 1.058] outages/year
That range means the true underlying rate could be anywhere from one outage every 13 years to one per year.
4. Computing the Probabilities
Plugging this rate into the Poisson model gives:
| Time Horizon | Expected Outages (λ × T) | Probability of ≥ 1 Regional Outage | 95 % CI Range |
|---|---|---|---|
| 1 year | 0.36 | 30.4 % | [7.2 %, 65.3 %] |
| 3 years | 1.09 | 66.2 % | [20.1 %, 95.8 %] |
| 5 years | 1.81 | 83.7 % | [34.3 %, 99.5 %] |
| 10 years | 3.62 | 97.3 % | [66.5 %, ≈100 %] |

5. Interpretation
In plain English:
- There’s roughly a one-in-three chance of another regional outage within a year.
- Over the next three years, the probability climbs to about two-in-three (≈ 66 %).
- Over a five-year horizon, an outage becomes almost a certainty.
Even with wide confidence bounds (because only three events exist in the dataset), the takeaway is clear:
Regional outages are not “black swans” — they’re periodic.
6. Practical Takeaways for Engineers and Architects
-
Design for region failure.
Multi-region deployment should be considered a baseline, not a luxury.
Assume you’ll loseaustralia-southeast1oraustralia-southeast2roughly every few years. -
Quantify your recovery objectives.
If your RTO/RPO cannot tolerate a multi-hour disruption, you must replicate across regions or clouds. -
Expect clustering.
The Poisson model assumes independence; real-world power or network events can violate this.
Plan for correlated failures. -
Track empirical rates.
Google’s transparency has improved. Keeping a rolling 10-year dataset lets you re-fit λ yearly.
7. What This Means for Risk Modelling
If you’re pricing or insuring critical workloads, or setting SLAs for customers hosted solely in one GCP region, this model gives you a quantitative baseline risk.
For example:
- Hosting only in
australia-southeast1→ ~30 % annual outage risk. - Replicating across both SYD and MEL → roughly halves that risk (assuming independence).
- Replicating across different continents → drops it below 5 % per year.
8. The Broader Context
Outages like these aren’t unique to Google Cloud.
AWS, Azure, and Oracle Cloud all show similar long-tail distributions — infrequent but high-impact events dominated by infrastructure or control-plane faults rather than isolated product bugs.
Poisson modelling provides a transparent baseline for quantifying operational risk when empirical data is scarce but consequences are high.
9. Conclusion
Based on the last eight years of GCP’s history in Australia:
There’s roughly a 66 % chance that at least one major regional outage will occur in the next three years.
That probability rises above 80 % within five years.
For critical systems, the implication is simple:
- Don’t bet on a single region.
- Test cross-region failover paths.
- Treat “once every few years” as normal, not exceptional.
Appendix — References
- Google Cloud Status Dashboard – Public Incident History
- Google post-mortems for 2022-12-09, 2024-05-08, 2024-10-29
- Ross, S. M., Introduction to Probability Models, 12th Edition